The Basics
Bitfields
Natu uses distinct types for cases where several values are bit-packed into a single integer. These are documented similarly to object types:
- type Color = distinct uint16
A 15bpp BGR color value. The red, green and blue components can be accessed via the following fields:
Field
Type
Bits
Description
rint
0-4
Red component
gint
5-9
Green component
bint
10-14
Blue component
Fields for these types are implemented as getters and setters, so you use them like so:
var c = Color(0)   # initialise to binary zero.
c.r = rand(0, 31)  # assign a random red value.
# c.g += 10        # not allowed. :(
See the bits module if you would like to create such bitfields yourself.
I/O Registers
Many modules expose “memory-mapped I/O registers”. These are special variables which are used to interact directly with the hardware. Usually they are implemented as bitfields (but may sometimes be plain integer types or sets).
For example:
dispcnt.blank = true # Turns the screen white!
Some registers are read-only – these are defined using let instead of var. Others are write-only, and attempting to read from them will give you a garbage result, e.g.
bgofs[0].x = 123
printf("%d", bgofs[0].x)   # prints 1042 !!!
For the registers which are bitfields, the macros init and edit are available. These can be used to set multiple fields at once, which is more efficient than setting fields individually:
dispcnt.init(mode = 4, bg2 = true)
For any fields that you didn’t specify, init will reset them to zero, while edit will leave them unchanged. Naturally edit is unavailable for write-only registers, since it would have to read the register in order to preserve the fields.
Using a debugger
It’s recommended to test your game in mGBA using the .elf file instead of the .gba ROM, as this will make debug information (names of functions & variables, line numbers etc.) available to you.
When your game encounters an assertion failure, out-of-range or out-of-bounds error, you will see a blue screen like this:
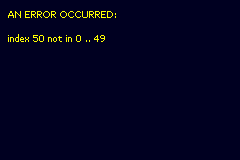
Upon reaching this screen, the game deliberately enters an infinite loop, allowing you to attach a debugger to inspect the state of the program when the error occurred.
To do this in mGBA, go to “Tools -> Start GDB Server” and click “Start”.
Now open a terminal and use arm-none-eabi-gdb to read the symbols from your .elf and join the remote debugging session:
$ arm-none-eabi-gdb -q YourGame.elf -ex "target remote localhost:2345"
In the GDB session, you’ll find the following commands useful:
bt(backtrace) - view a stack trace.frame <n>- switch to a stack frame.info locals- display the local variables in the current stack frame.print <expression>- display the value of a variable.
Note
The debug info is based on the mangled names from the C code generated by Nim, making it somewhat difficult to read. It’s possible to get used to it with a bit of practise. You can also pass the --linedir option to the Nim compiler, allowing you to step through lines of Nim code instead of C code. However, the accuracy of the reported line numbers isn’t fantastic.
You can also use GDB to hunt down more elusive problems such as logic errors and messy crashes. In these cases, you can use a shell script to launch mGBA in debug mode with the -g flag, put it into the background, then immediately connect to it (after a small delay to give it time to start up):
$ mgba-qt -g YourGame.elf &
$ sleep 2
$ arm-none-eabi-gdb -q YourGame.elf -ex "target remote localhost:2345"
$ start "" /B "C:\Program Files\mGBA\mGBA.exe" -g YourGame.elf
$ sleep 4
$ arm-none-eabi-gdb.exe YourGame.elf -ex "target remote localhost:2345"
For such problems you will also find the following to be useful:
b <filename>:<line>- set breakpoint - pause when a given line is reached.watch <symbol|expression>- set watchpoint - pause when a value changes in memory.s- step forwards by 1 statement, going into any subroutines.n- advance to next statement, skipping over any subroutines.c- continue execution (useCtrl + Cto pause again).
For more info on how to use GDB, I recommend Beej’s Quick Guide to GDB and the GDB Cheat Sheet on DuckDuckGo (based on this reference card).
Caveman debugging
In many cases, using a step debugger is overkill, and you can get all the information you need via simpler means:
If the problem is graphical, consider what the tile, map, palette & sprite viewers in mGBA ought to be showing, and check them to see how they differ from your expectations.
Use
printffrom the mgba module:Dummy strings can help to you know if a line of code is actually being reached at all.
To print an integer, use the
%lformat specifier.To print a pointer, use
%08X.